The Visual API
Abstract
Large visual automation applications are rarely developed due to the complexity required for a robust application and the inability to test the codebase. This paper explores the reasons for the complexity and the inability to test, and in doing so, finds solutions to both. The concept of the visual API is proposed as a new standard for developing visual automation and a new open-source framework is introduced that streamlines the process of building a visual API.
1 Introduction
Visual automation is difficult, and no source attests more clearly to this than the industry where it is used the most, the software testing industry. The market for software testing was estimated at over $40 billion in 2020. However, the vast majority of these revenues did not go to automated testing applications. Industry participants prefer to invest in manual testing, apparently due to the relative high costs of developing automation as compared to the cost of human testers. The decisions to use human testers, especially for use-cases that seem ideal for automation, are clear indications of how difficult it is to develop useful automation.
There are two main problems with writing large visual automation applications: code complexity, and the inability to test the code. The solutions to both problems are somewhat codependent. As we explore the underlying causes of code complexity and the inability to test, the solutions to these problems should become apparent. The key to finding the solutions is to gain a deeper understanding of the automation task and to reframe how we view it.
2 Complexity
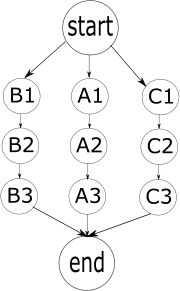
Below is a simple process involving visual automation. We want our program to perform three actions, one after another: first A1, then A2, then A3.

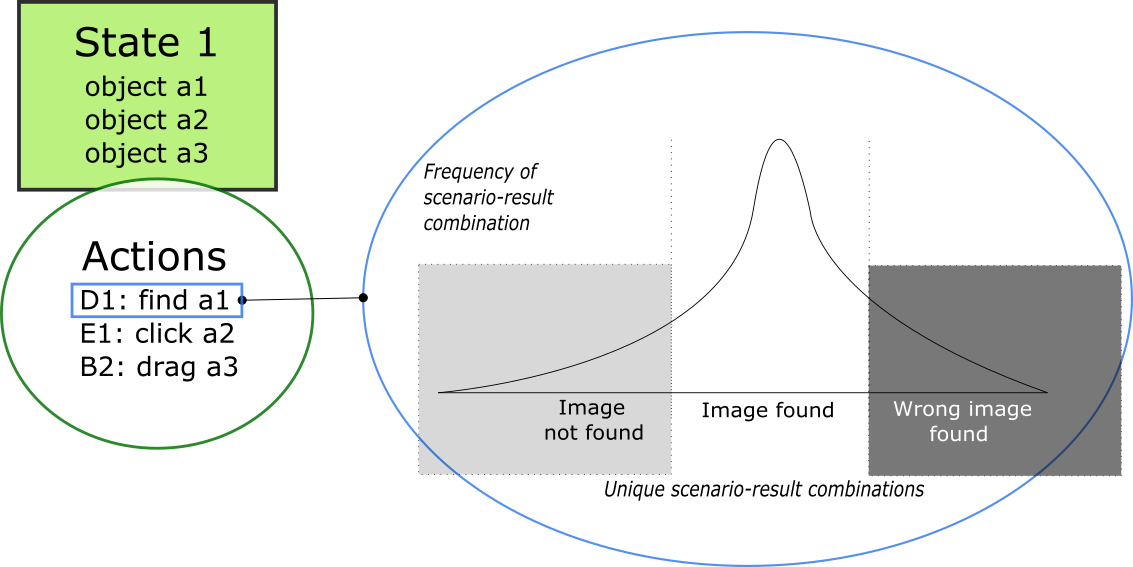
The first issue we run into is the stochastic nature of actions A1, A2, and A3. Visual process automation is not guaranteed to succeed. For each action, there are many different potential outcomes. Taking the example of an action that attempts to find an image, potential outcomes include:
- The image on screen is the same as in the program, and it is found.
- The image is slightly different but found.
- The image is slightly different and not found.
- The image is covered by another image (an unexpected pop-up, for example), and the image is not found.
- The image does not exist (maybe the automation program is not where it expects it to be).
- A different image is found.
- The same image appears multiple times on the screen and the program finds the wrong one.
- The image will appear but takes longer than expected, and the operation times out.
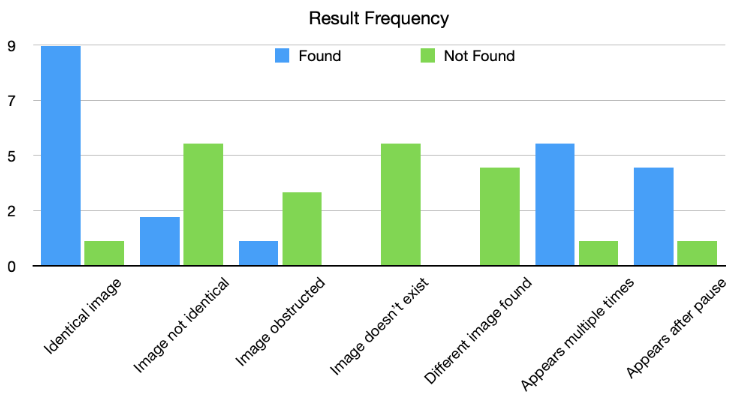
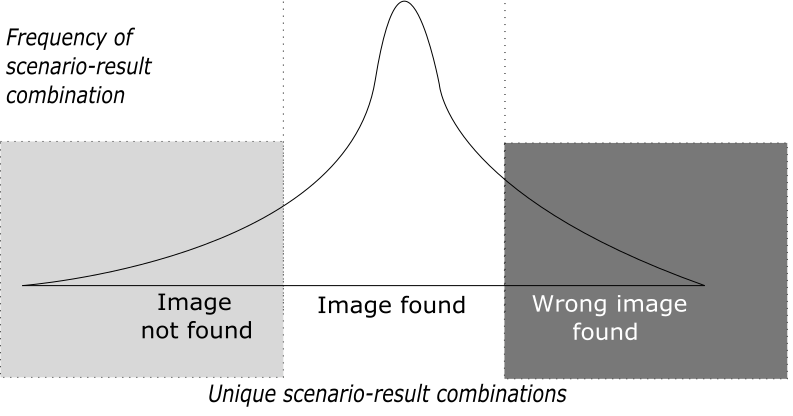
In reality the result frequency is a continuous variable since there could be an infinite number of different scenarios. You might portray the continuous variable as having a few different categories of results: found, not found, and found erroneously. What you do in these scenarios may differ depending on the scenario. If an image is not found because the image on the screen is slightly different from the image on file, you may want to adjust the sensitivity of your find operation. If the image is not found because your application thinks it’s somewhere else, then your solution will be to move to the correct environment.
Stochasticity is especially dangerous for automation applications because of the
interdependency of actions. If A1 fails then A2 and A3 are also likely to fail.
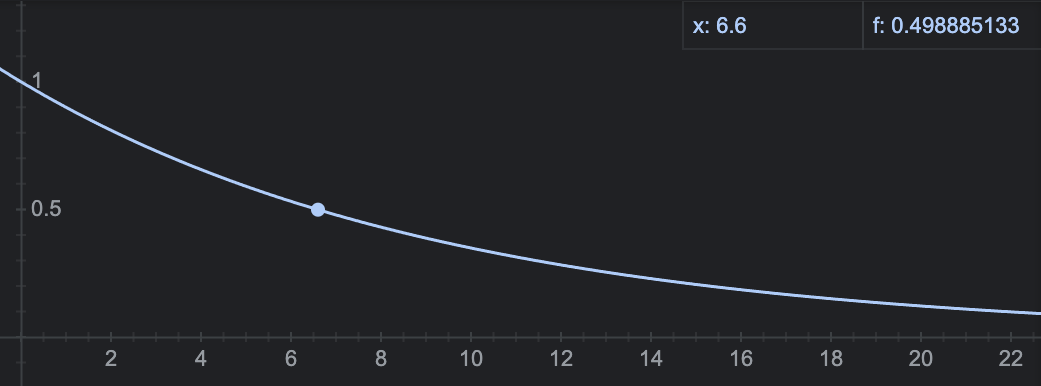
If an automation program is a series of actions, the probability of the program
failing will be related directly to the number of actions. If each action is
given a probability p of succeeding, and there are n actions, we can calculate
the overall probability of success as a function of n and p: f(n,p) = p^n.
f(n,p) looks like this when setting p to 90%: at just 7 actions the process
is more likely to fail than succeed, and the chances of success with a large
number of actions is extremely low.
Given that failure is likely, a robust application must take this failure into account and provide alternate processes in order to reach its goals. Having alternate routes to the end goal will increase the overall probability of reaching this goal.
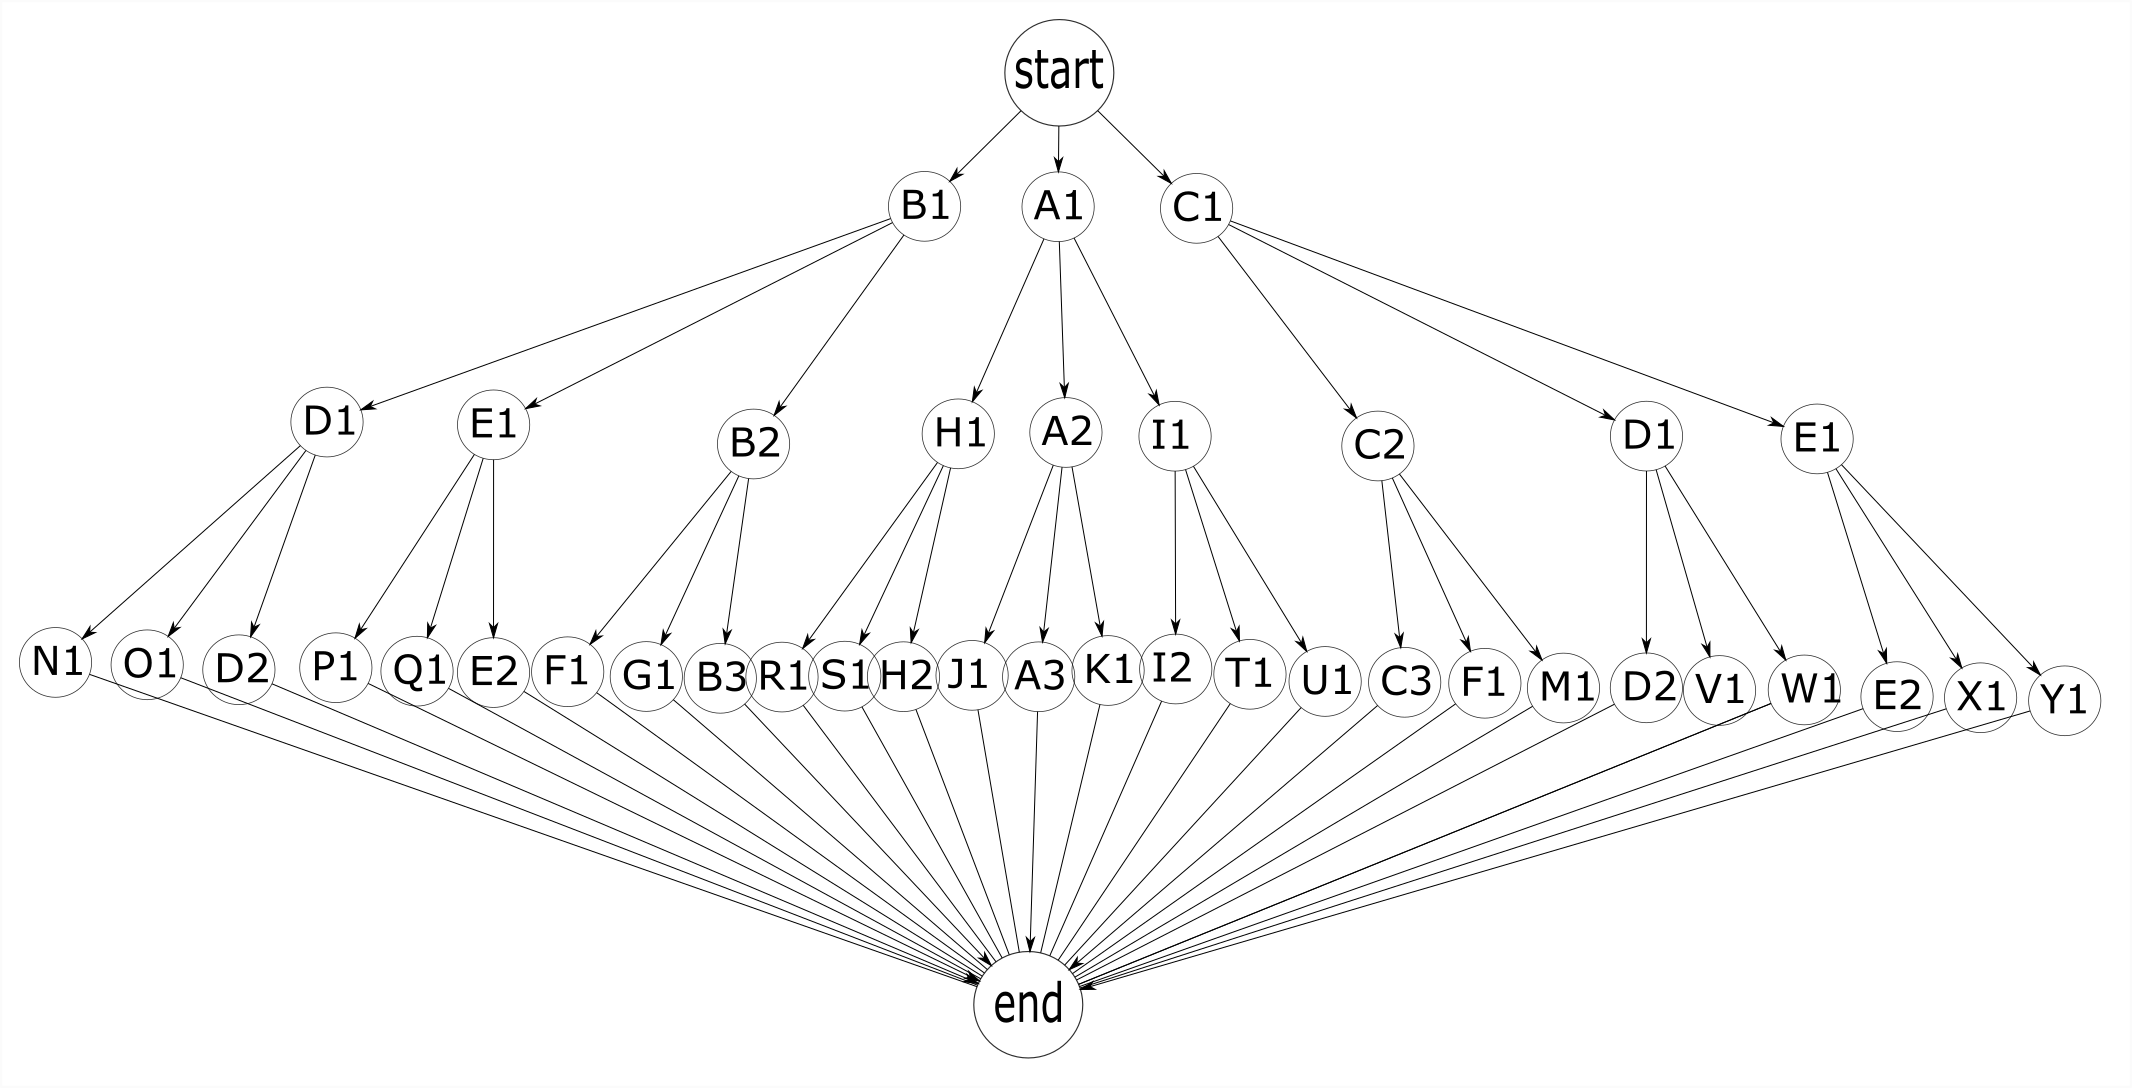
A process is a series of successive actions. A process follows a path through
different environments and this environment may change as the result of a successful
action. If there are 3 different processes, A, B, and C, that can reach a goal, and
each action in {A1,A2,A3,B1,…,C3} has probability p of success, then the probability
of success for each process is p^3.
At first glance, it would seem that the probability of success for the entire algorithm is
1 - (1 - p^3)^3 because in order for the entire algorithm to fail, all 3 paths
would need to fail. When p = 90%, the probability of a single process succeeding is
72.9% and the probability of the entire algorithm succeeding is 98%. This is, however,
incorrect. Since actions can change the environment, the only place where the
additional paths would be available is at the start point. We only have backup
processes at the start point, after which we have to follow the process we have
chosen. In other words, if A1 fails we can try B1, but if B2 fails our algorithm
has failed. In this diagram there is no path back to the start point. This gives
us a success rate in the first layer of p + p(1 - p) + p(1 - p)^2 = 3p - 3p^2 + p^3, since there is a p chance of A1 succeeding, a p chance of B1
succeeding in the event that A1 fails, and a p chance of C1 succeeding in the
event that both A1 and B1 have failed. In the second and third layers the
probability of success is just p. This gives an overall probability of success of
p * p * (3p - 3p^2 + p^3) = 3p^3 - 3p^4 + p^5. With p = 90%, the overall
probability of success is just ~80.9%.
To keep the probability of success around 99% we would need to create
alternate processes for each action, including the actions in processes
B and C. If there were n original actions, the total number of actions in
our more robust algorithm would be 3^n + 3^(n-1) + 3^(n-2) + ... + 3^1.
In this example, with n=3, we have 27 + 9 + 3 = 39 actions. The run-time
complexity is still linear since only a small subset of all actions will
be performed, but the programming-time complexity is exponential.
Programming-time is even more valuable than run-time because your time
is more valuable than your computer’s time! That is, after all, the whole
point of automation. This programming-time complexity also can be described
as NP-hard, or
Not Programming this, this is too hard!
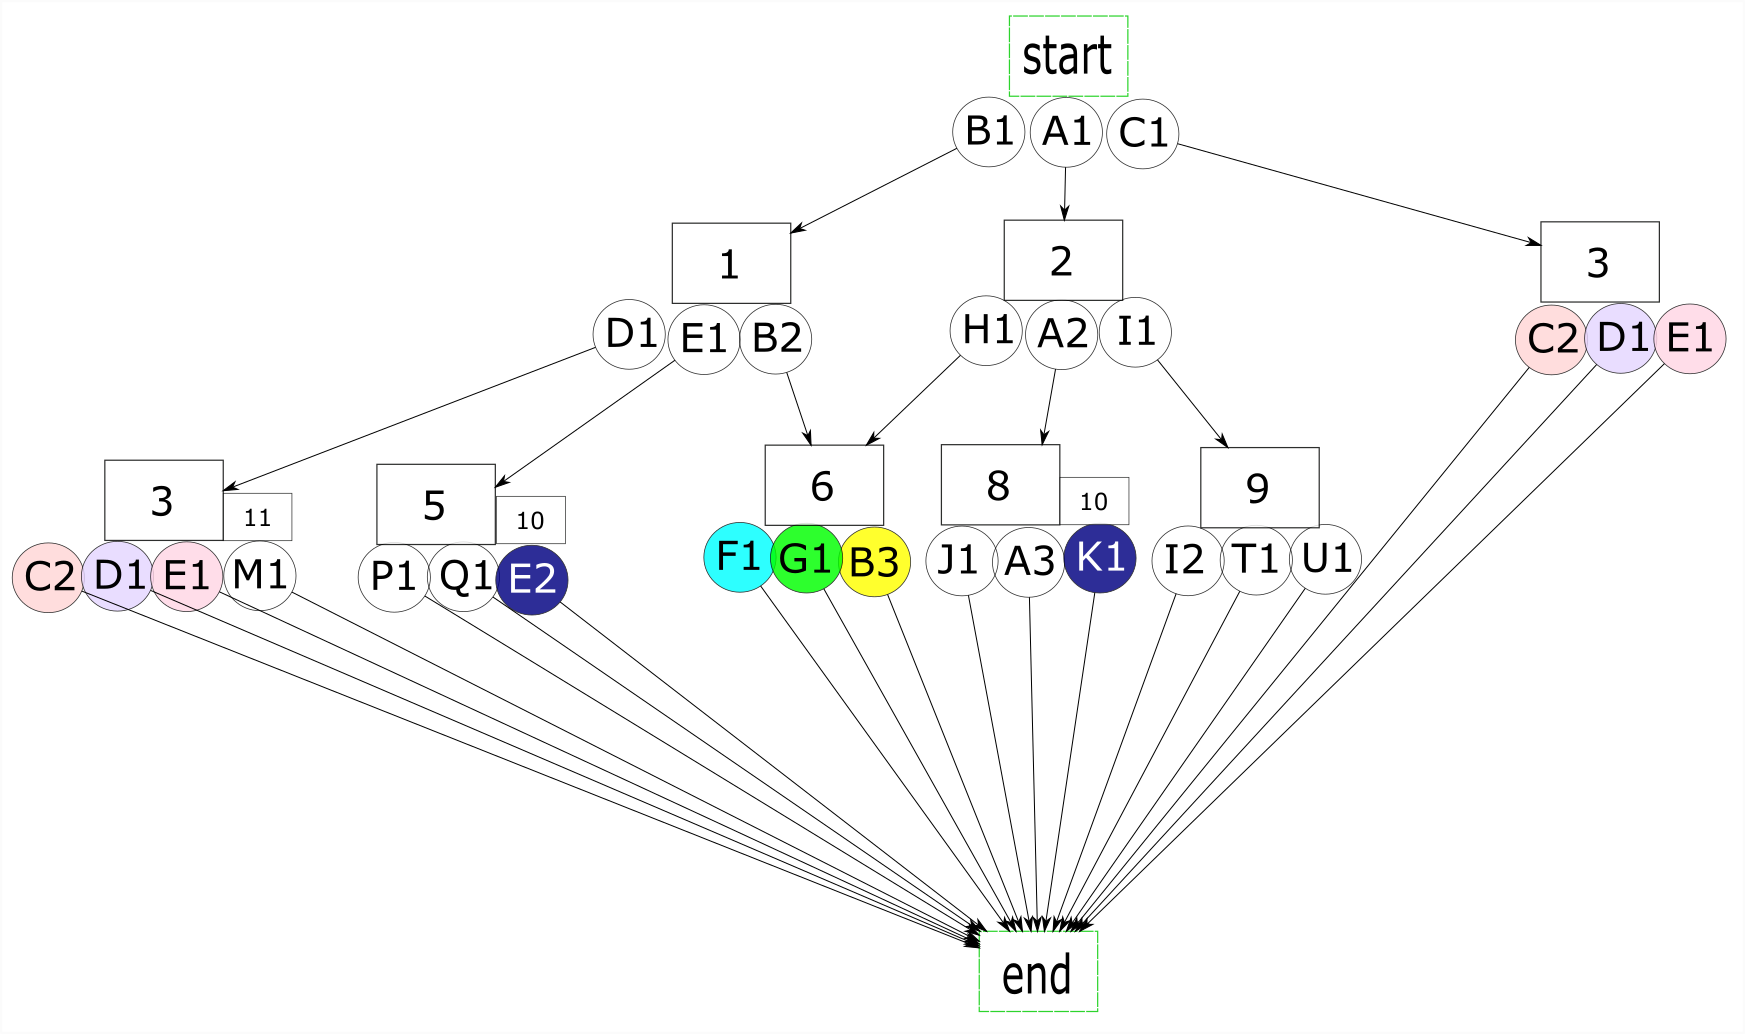
3 Reducing Complexity
We need to simplify the application somehow to make it feasible to write larger programs and to be able to test them. In a given action tree, we’re likely to find duplicate actions that lead to the same expected outcomes. The actions in this tree with the same color represent duplicate actions. For an action to be considered a duplicate, it must have the same functionality but also the same expected results as another action. This is the case for actions F1 and R1, G1 and S1, and B3 and H2. In addition, actions that lead to the same set of duplicate actions, as in the case of B2 and H1, are also duplicates.
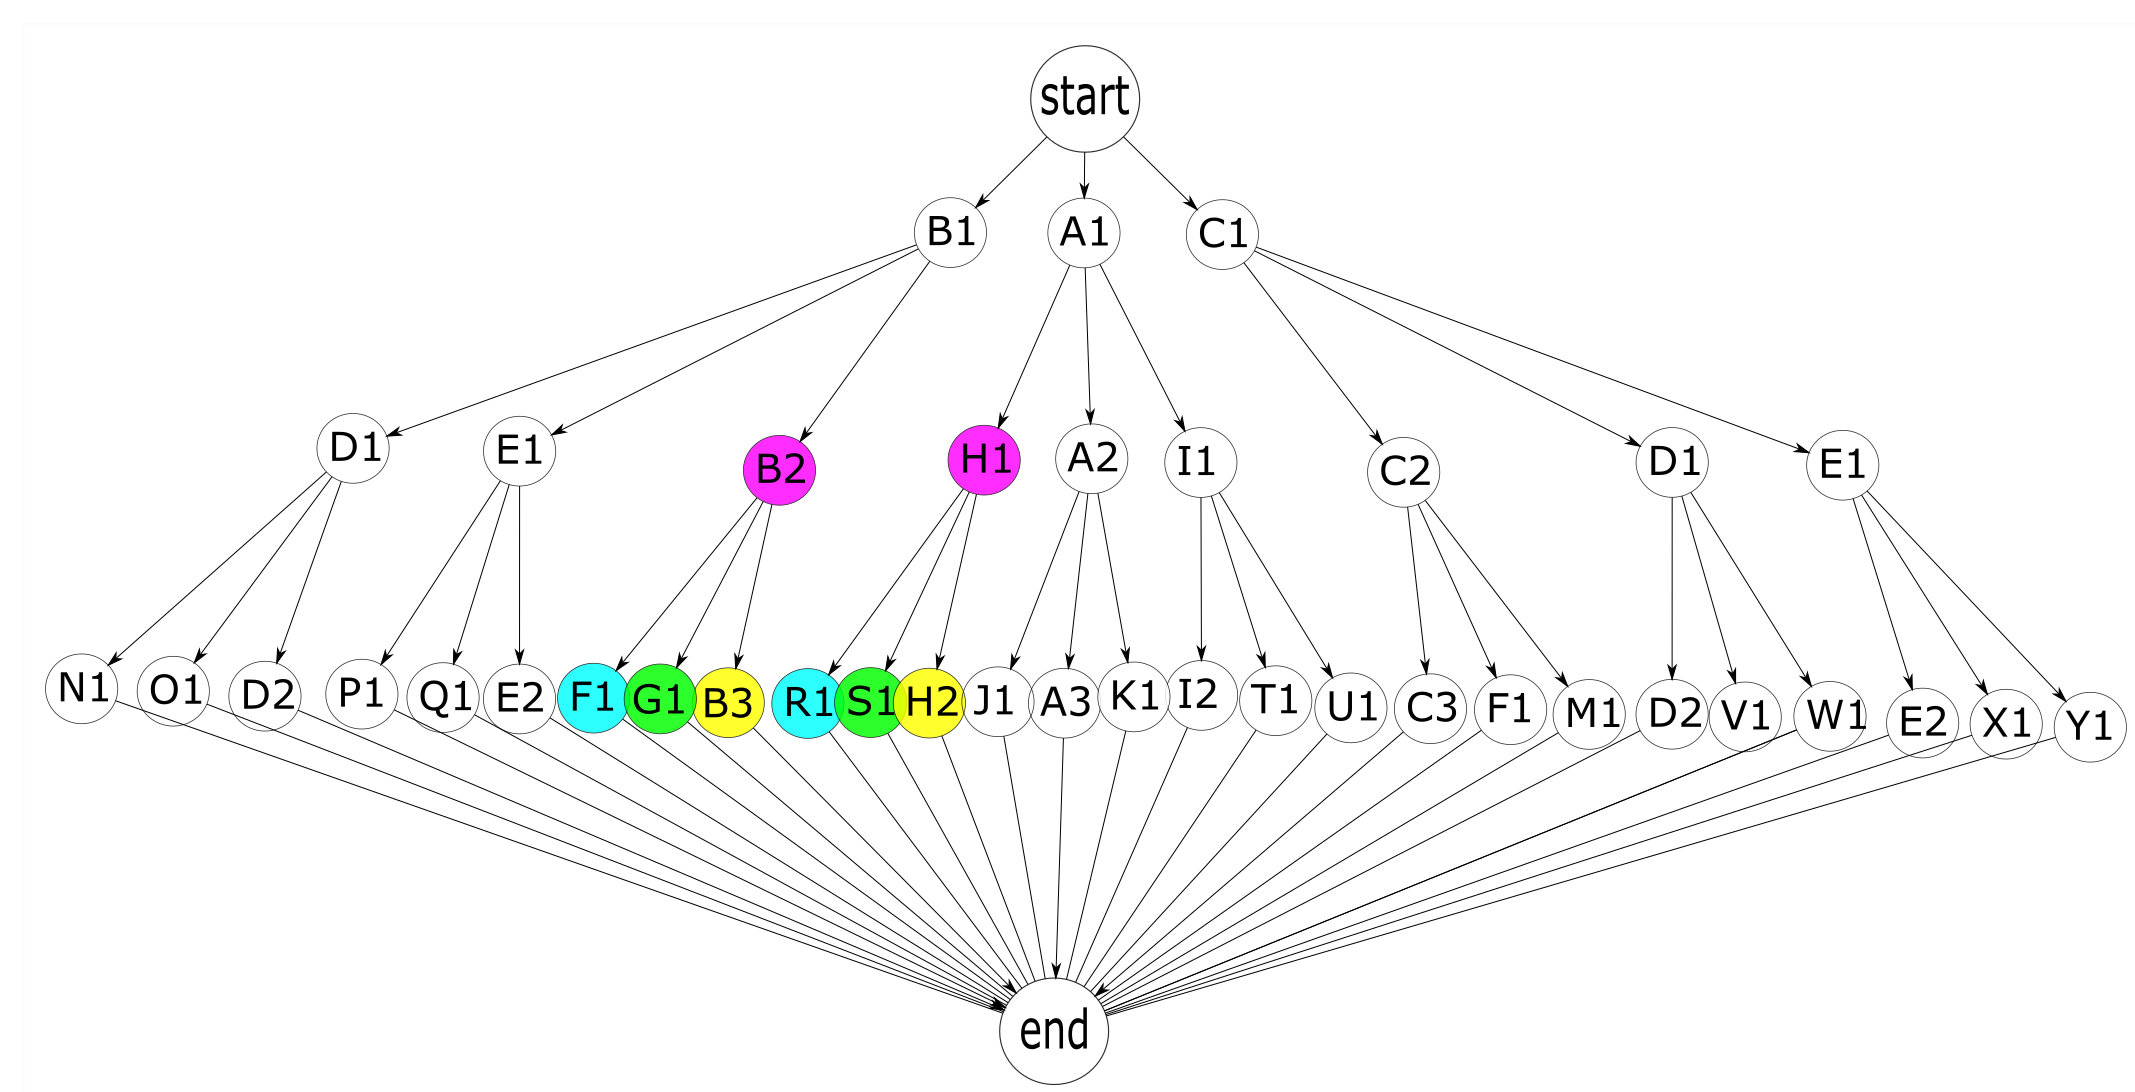
Duplicate actions such as B2 and H1 lead to the same environment, in which the same actions are available. Whether all details of the real environments after a successful B2 or H1 action are actually the same or not is not important to us. What’s important is how our application views the world it is in, and it views it in terms of potential actions and their outcomes. Despite being just a collection of processes, this program has an implicit model of the environments it moves around in. Duplicate actions are an indication of the implicit existence of repeating environments.
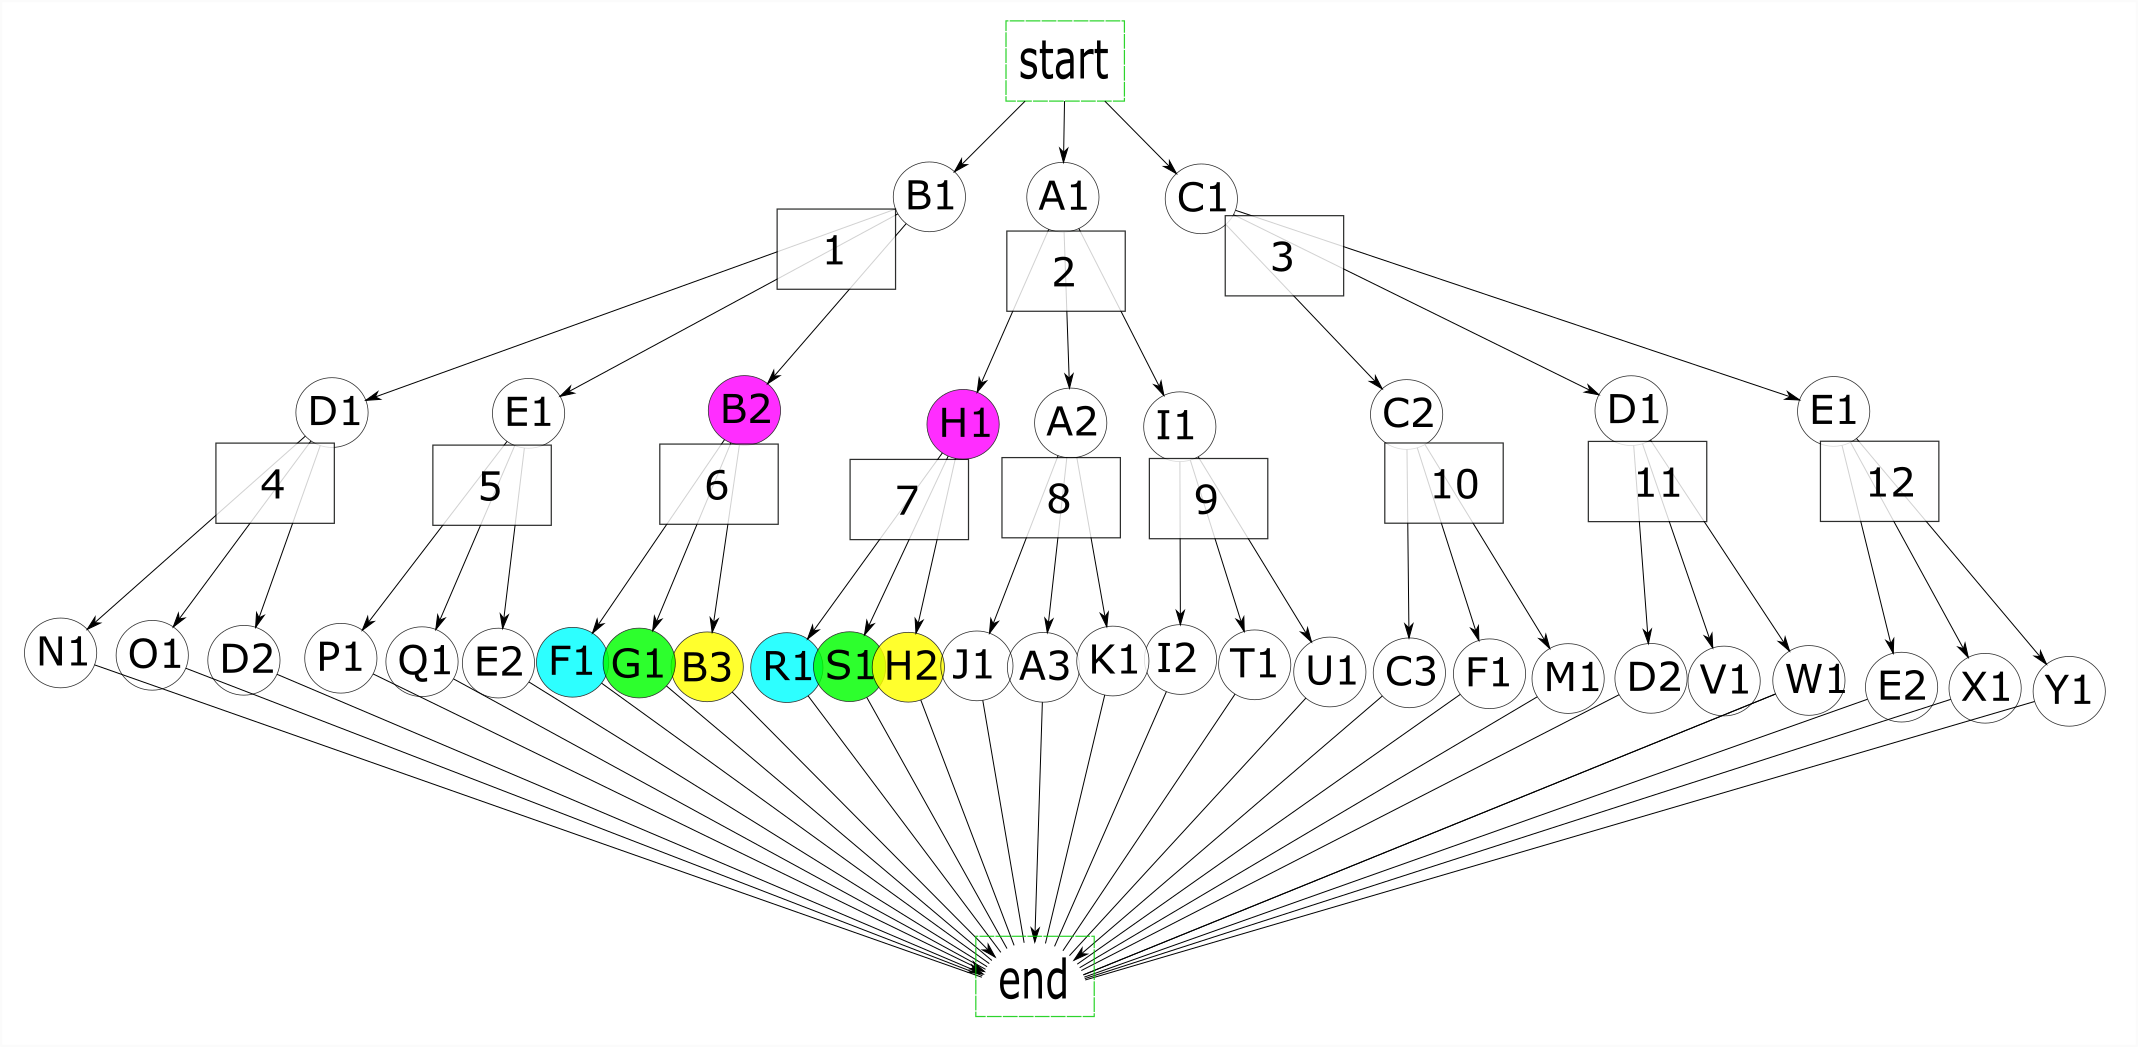
Let’s start to include these environments explicitly in our graph. We’ll introduce the concept of a state, which in this context refers to an environment containing actions with expected results. The successful completion of actions B2 and H1 would take us to the same state (in figure 8, states 6 and 7 represent the same state and could be combined into one state). In figure 8, states are added as rectangles and processes remain as circles. The start and end points are changed to rectangles as they are states and not actions.
In figure 9, I made some changes to our processes for illustrative purposes. The new graph shows how states can be shared at any level of the graph, and how states can coexist. I made the three actions in state 3 (C2, D1, E1) go directly to the end state and made them duplicates of N1, O1, and D2 in state 4. Finally, I added action M1 to state 4 so that state 4 and state 3 would not be duplicates, and made E2 and K1 duplicate actions.
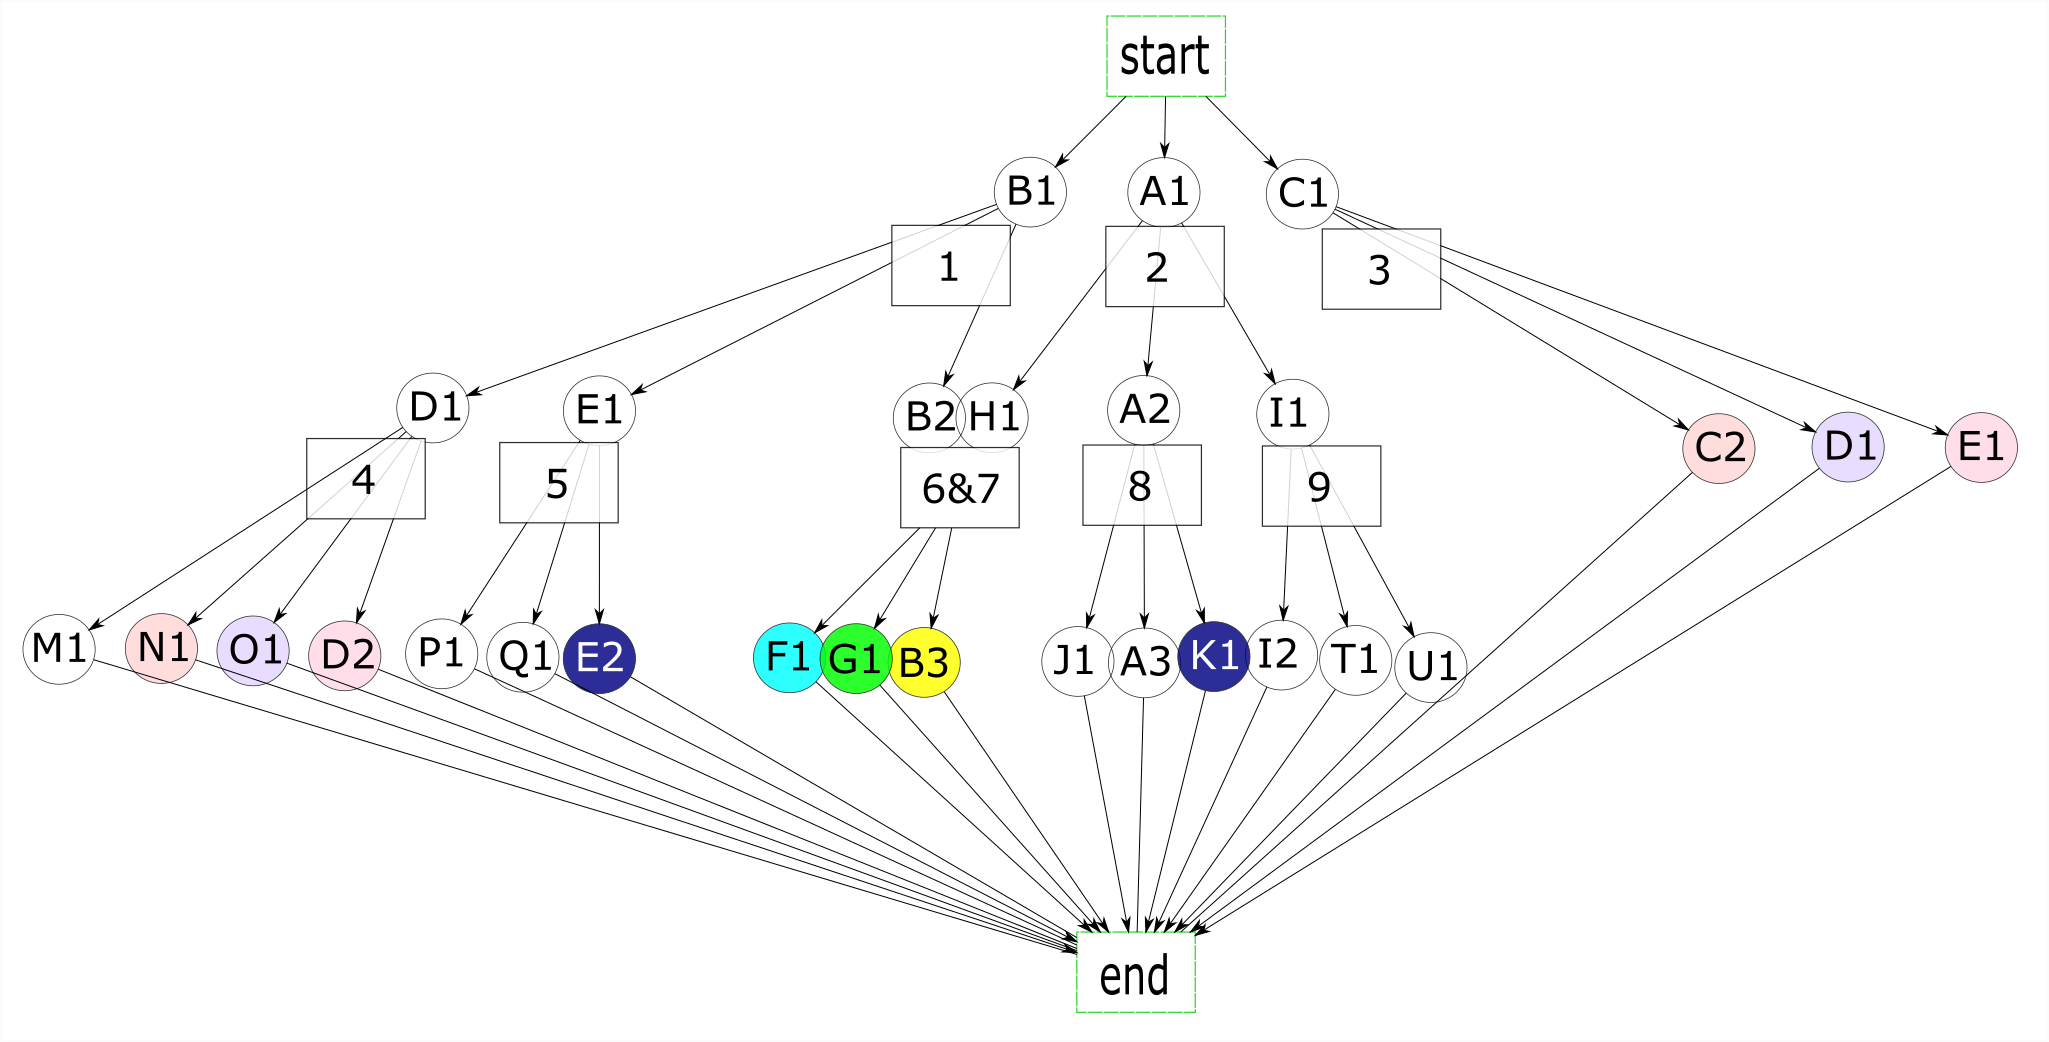
E2 and K1 are duplicate actions, but their environments have other actions that are not duplicates so we can’t combine the states currently representing these environments (states 5 and 8). Instead, we create a new state (10) and let it coexist with both state 5 and state 8. The same applies to states 3 and 4. State 4 has an action that state 3 doesn’t, preventing us from treating these two states as duplicates. Instead, we group the 3 duplicate actions into one state (3), and let this state coexist with a new state (11). We replace state 4 with the set of states 11.
The graph can have cycles, and in fact a robust application will have many cycles. More paths available to reach the goal will increase the probability of reaching it. Adding states to a fully connected graph with many cycles will increase the available paths exponentially. A large application will have many goals, and optimally the states and transitions can be reused for these goals. An exponential growth in paths relative to a linear growth in states is what reduces the complexity of the code while maintaining the robustness of the automation application.
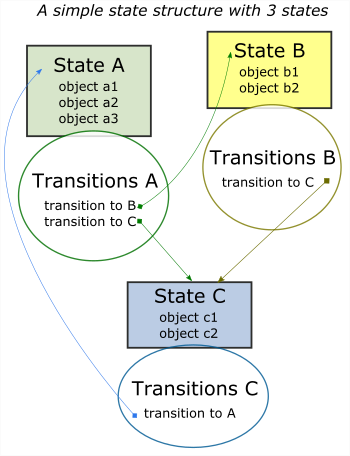
4 Modeling the Environment
In figure 10, we moved the states down to group them with the actions they have available to them. This is a more intuitive way to view a graph of states and associated actions. In restructuring a graph of actions to a graph of states, we change the focus of our analysis from process to environment. Instead of considering what actions need to be taken, we think about the environments we need to pass through in order to reach our goal. This new graph resembles in some ways that of a non-deterministic finite automaton in that it has sets of states with transitions leading to other sets of states.
Now that we have a model of the environment, we have a way to simulate actions in this environment. In restructuring our model, we have moved from programming a process flow to programming a model of our target environment. Our automation program is no longer a standalone application with a collection of processes, but a specific set of instructions to be run in our modelled environment. The model of our environment, composed of states and transitions between states, is referred to as the state structure.
Writing an automation as a series of processes makes assumptions about the environment that are implicit but not directly stated in the code. A program that gives the statement: click A and then click B gives an assumption that B will exist after A is clicked. The model of the environment, because it is conceptual and not explicitly stated, remains difficult to visualize and impossible to work with. It is also a reason why many automation applications written as process flows will fail: the model environment defined by the assumptions often contains inconsistencies not found in the real environment.
env^ ≠ env
In changing our focus from processes to environments we have changed our focus from writing an automation process to developing a model of the environment. A good model is a realistic representation of the real environment. Such a model usually requires 2 components: a description of the state of the environment and a model of causality (the actions that are possible and the changes they produce in the environment).
5 Causality
Our model of causality looks at actions taken on objects and the results of these actions on the environment. The first component, actions taken on objects, is generalizable to all visual automation applications. The actions possible in a GUI (Graphical User Interface) are the same for every GUI. The second component, the results on the environment, are application-specific since the environments themselves are application-specific.
The actions taken on objects are represented by real actions that can be performed in a GUI. They comprise functions such as clicking, searching for images, dragging, and typing, and are the same functions we would use to write the actions in our process-based automation applications. We take the base functionality for these actions from SikuliX, a library of commands for GUI manipulation that builds on OpenCV for image recognition, the Java Robot class for controlling the mouse and keyboard, and Tesseract for text recognition.
We then imbed causality into these functions. Searching for an image can produce different results based on the image we are looking for and the environment we find ourselves in. There are a couple of assumptions we make to simplify the expression of causality. We assume that objects belong to states and define objects accordingly in our code. When the environment does not include an object’s state, the object does not exist and won’t be found. If the object’s state is active in our environment, the results of an action on the object will follow the object’s random variable associated with this action.
For example, we are in the environment with state 1 and we want to execute action D1, which involves finding an image. If this image does not belong to state 1, it will not be found. If it does belong to state 1, we should expect to get a result corresponding to the distribution of results for this image with respect to a find operation.
If this process seems complex, it’s because it is complex. This complexity is part of the reason why it’s prohibitive to create a simulation of the environment in order to test an automation application. Random variables with different outcomes need to be designed for each possible action and for each object. The correct random variable then needs to be sampled by the action taken to give us a result, and this result needs to be incorporated into our simulation.
Once again, this is complexity that can be simplified. All of these functions can be performed by a general algorithm, one that doesn’t know any specifics of our environment or our object and that receives information about the environment and the object as parameters. The entire process can be controlled by a framework and the only thing we would need to provide would be the state structure.
6 The Framework
The next step is the development of a framework that can take a state structure as input and create a model of the environment that allows for simulation and manipulation of the environment. Given a transition from the state structure, it should be able to exit and enter states. Optimally, we will be able to find paths to a state dynamically as the program runs, and readjust our selected path when faced with unexpected changes in the environment. It is, after all, a stochastic process, and a robust application will need to deal with unlikely results as well as expected results. Not having to code this explicitly and letting the framework take care of it for us will make our job as the application developer much easier.
Figure 10 shows all potential environments, or sets of states, that we can reach given the transitions available to us. With this view of the graph, it follows that we could find all potential paths to our goal by performing a search on the states and associated transitions. Since each process can fail with a variety of outcomes, we have to account for failure when moving through paths. If the process fails and the states have not changed, the next best path is tried. If an action in the path succeeds, the active states are updated and the next action in the path is tried. At this point, if the current action fails, new paths need to be searched for. The old paths are no longer valid since we find ourselves at a different environment than at the beginning of the path. For example, at state 1, the available paths are different than the paths available at state 6, after we successfully transitioned with action B2.
Having a framework take care of path searching and movement from state to state makes our application much simpler, as now we just need to define states and the transitions between individual states. The compartmentalization of our code into states and transitions also adheres to the single responsibility principle and further simplifies the code. States hold the objects that define a certain environment and transitions contain methods that can act on these objects to change the environment.
This framework, called Brobot, exists already as an open source repository and lives here. The part of Brobot that takes care of movement within the environment is referred to as the Brobot engine. The Brobot engine takes care of finding paths dynamically, traversing these paths, and keeping track of the active environment’s state composition.
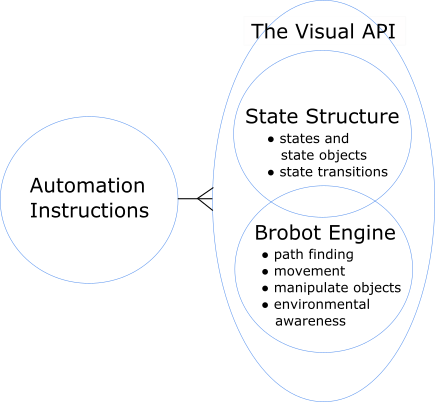
There are now 3 separate components to our automation program:
- The Brobot engine
- The state structure
- Automation instructions
7 The Visual API
API stands for Application Programming Interface. APIs are used to communicate with
an external application, and are omnipresent in the software domain. Programs use
APIs to call methods from 3rd party libraries and to run tasks that depend on other
software applications. In artificial intelligence research, APIs are used to control
games to test and train reinforcement learning algorithms. The board game Go and
the RTS (Real Time Strategy) game Starcraft are two examples of games that use
APIs to enable automation. The famous reinforcement learning program
AlphaGo
updates the positions of all pieces on the board based on player decisions.
The code that does this updating, even if it exists only as an internal class
or as a few methods, acts as an API between the reinforcement learning algorithm
and the game environment. In the more complex environment of StarCraft, the
developers of the game provide an API to programmers and AI researchers. The
StarCraft API
provides detailed information about the pieces in the game and
their positions, as well as allowing a program to manipulate these pieces
according to the game rules. In both Go and StarCraft, env^ = env since
the game environments are converted to a digital representation without information
loss. Having such a realistic model of the environment allows the researchers to
focus on the reinforcement learning algorithms and not worry about the accuracy
of the game environment or the mechanics of manipulating it.
The combination of the Brobot engine with the state structure produces a visual API.
Similar to a traditional API, the visual API allows the developer to control an
external application, which in the case of the visual API is the environment to
be manipulated by the automation application. This allows the automation
instructions to focus on business logic and ignore the details of manipulating
the environment. The visual API differs from a traditional API in that its functions
produce stochastic results. With a visual API, the model of the environment is not
equal to the real environment env^ ≠ env but is an approximation of
the real environment env^ ≈ env. An important objective when
creating a visual API is to reduce the stochasticity of its functions. There are
many ways to do this, and a comprehensive tutorial on building a visual API with
Brobot can be found in
this video series.
8 Testing
Before diving into the problem of testing, I need to clarify what is meant by testing. Testing can refer to a number of different topics, particularly with respect to visual automation.
Visual automation is often used to test new software. For example, an automation program will use the software and record the results of its actions. Visual automation is performed as a replacement for or supplement to manual testing, in which people try out software and report their observations to the company that developed it. This is not the type of testing we are interested in here.
Software also gets tested during development to ensure that new functions work correctly and do not negatively impact other parts of the code. This is not a finished program that tests another independent piece of software, as in the previous example, but code written within a test module that accesses the methods and objects of the functional modules. This type of testing is an important part of software development, as any change to a codebase can potentially introduce bugs both locally and in interconnected modules. Maintaining a clean and usable codebase depends on frequent and comprehensive testing of the code.
Testing code has two main flavors: unit tests and integration tests. Unit tests take a small part of the code and test its functionality under different scenarios. The same process applies to integration tests, but at a larger scale. Integration tests assess whether different parts of the program work well together. Normally, the application is complex and the tests are there to test this complexity in smaller pieces, whether unit tests or integration tests. These tests introduce different environments, represented by the inputs they provide to the algorithm, in order to see how the algorithm behaves in these environments.
Visual automation programs are typically not tested. They are not tested because testing requires modeling the environment, which we saw introduces more complexity than exists in a process-based automation application.
When we test visual automation, we are testing whether the automation will work in our target environment. If our simulated environment is a good approximation of the real environment, the tests should be useful. A failed test could mean that our automation application has issues. On the other hand, a failed test also could imply that our simulated environment is not realistic. In this case, the automation application would serve as a test of our model of the environment, as opposed to the simulated environment being a test of the application. It’s important to decide what our goal should be, whether we would rather develop a realistic simulation or whether we want to develop an effective automation application. The answer is, of course, both, because in the end we want to have a good automation application, but to achieve this we need a realistic simulation.
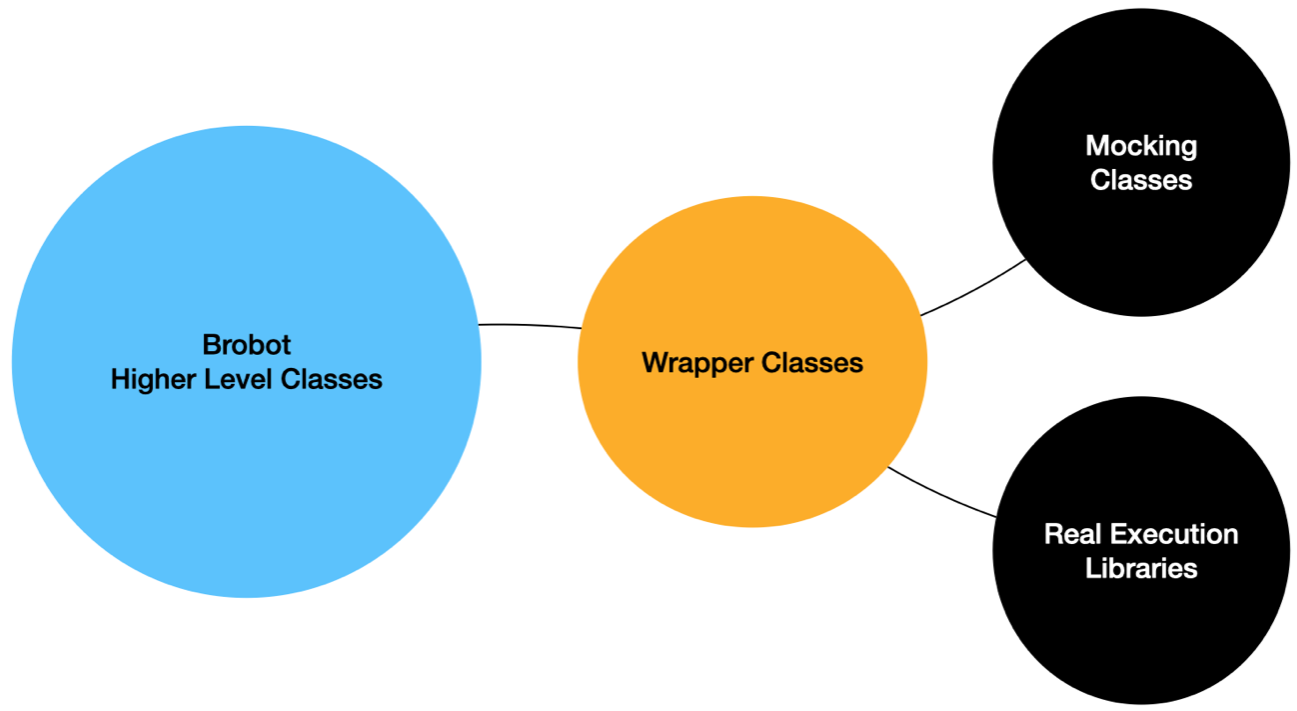
9 Simulation vs Real Execution
Our visual API needs to be able to execute our automation instructions as real actions as well as simulated actions. Real execution depends on our model of the environment in the same way that simulated execution does. Recognizing states, finding and following paths, and moving between states all require the same underlying model of the environment. The difference between simulation and real execution is that the results of these processes will be determined either by simulated input from random variables or by real operations carried out with the screen’s input, the mouse, and the keyboard. The framework receives inputs from either simulation or real execution in the same format. It contains a layer of code that abstracts the execution of actions and makes the simulation agnostic to whether it is being simulated or not. This layer sits between the classes and external libraries that perform real or mock actions and the classes that process actions. The abstraction layer decides whether to perform a mock or a real action. The framework does not know, at any point above this abstraction layer, if the operation is being mocked or executed on the real environment.
10 Simulation
In order to capture the stochastic nature of real automation, objects are initialized with the historical results of different actions. The results can be either taken from screenshots of the environment, as is done by Brobot’s state structure builder, or coded by hand. These data act as the outcomes of a random variable and provides a discrete distribution of action-specific results from which to sample.
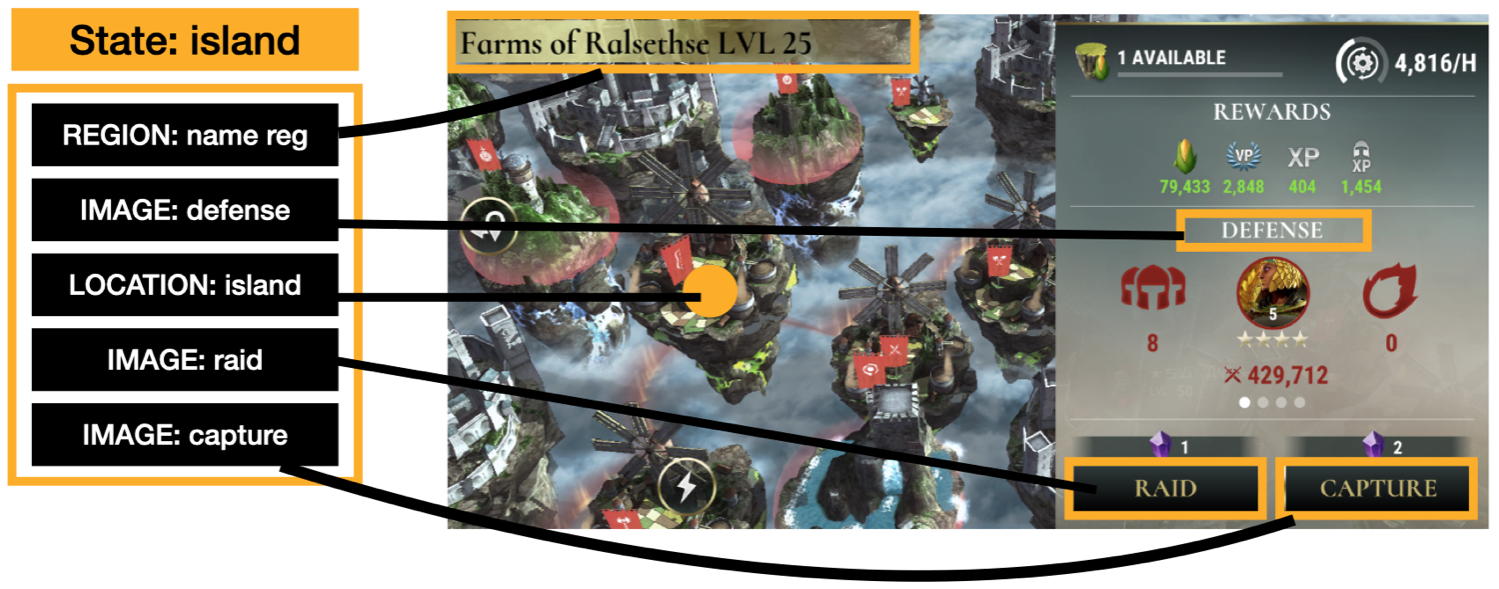
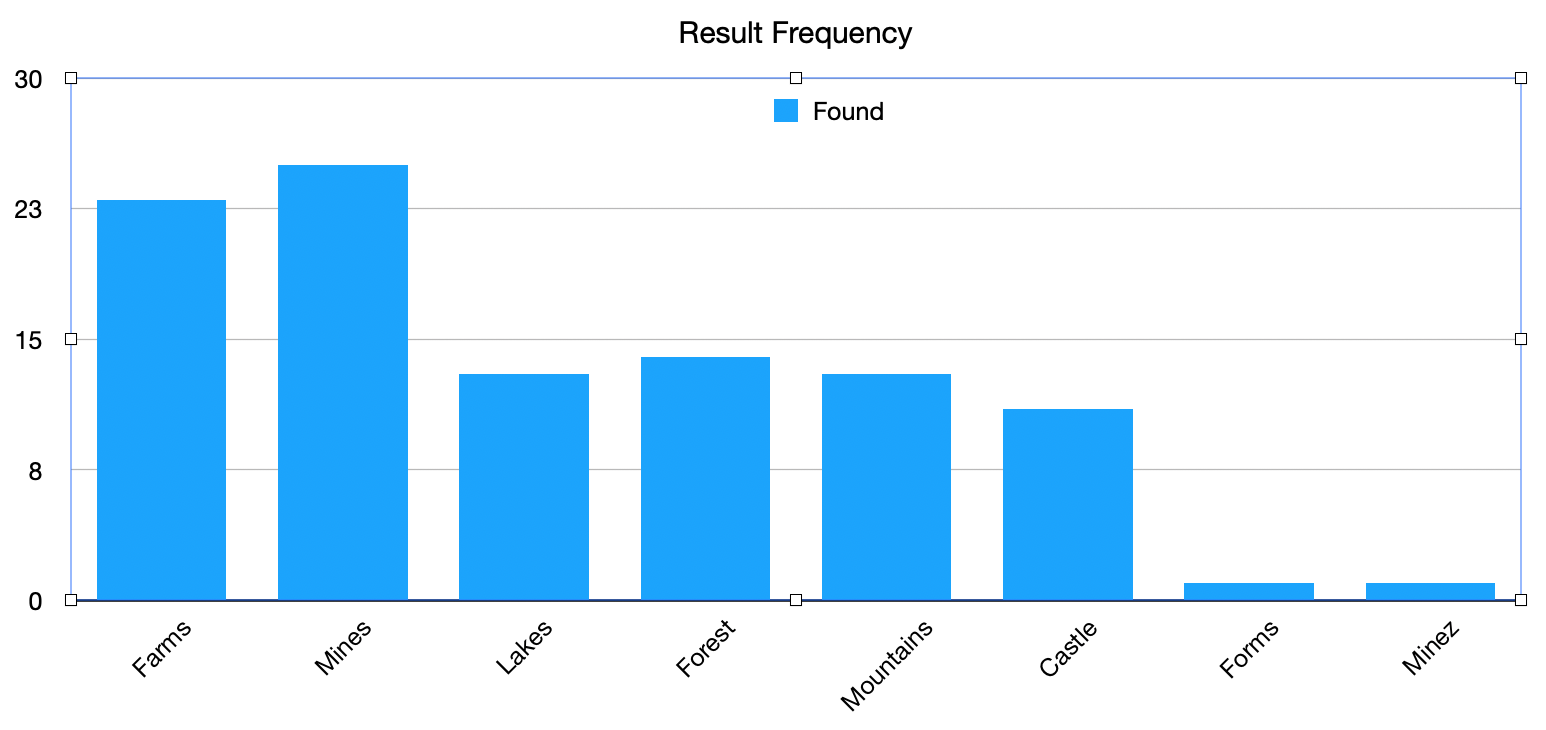
Below is an example of an object in a mobile game and its random variable. The image shows a state with 5 objects. The first object, called name reg, is a region object. Its random variable describes the results of a text retrieval operation on the region, which can be Farms, Mines, Lakes, Mountains, Forest, or Castle. The categories of the random variable include additionally the entries Forms and Minez to simulate the imperfect retrieval of data during visual automation. This example is taken from the basic tutorial, which shows how to automate the creation of a labeled image dataset.
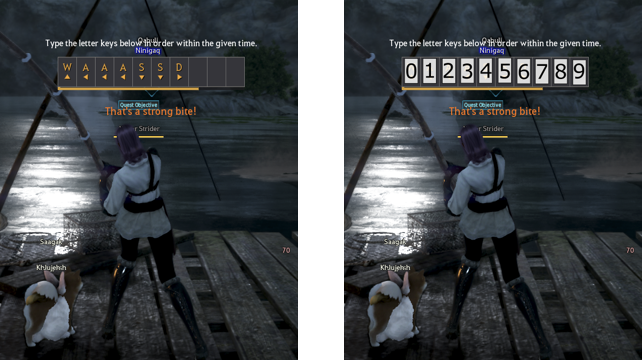
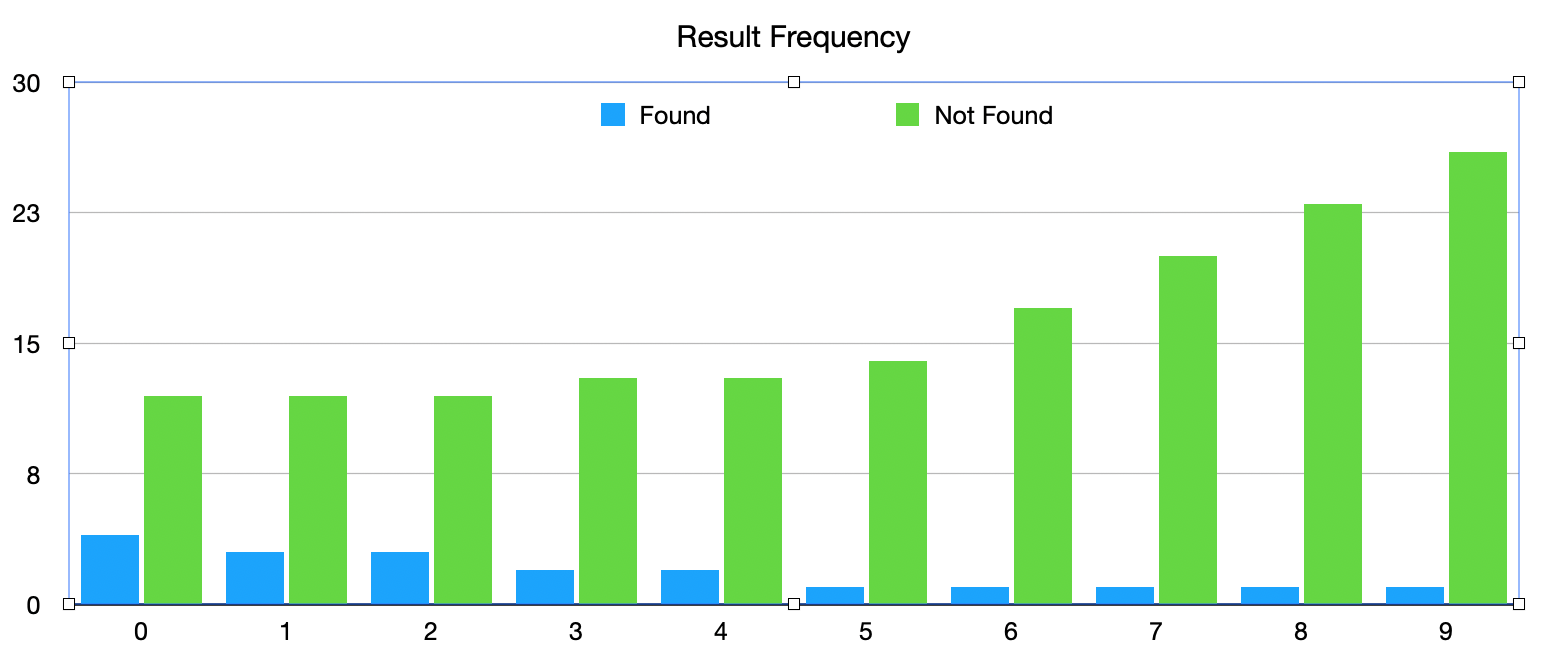
The next example depicts a character fishing in a computer game. When the character begins to reel the fish in, a series of letters appears on the screen, which an automation program would need to press in order to catch the fish. A random variable describes the likelihood of the letter „W“ appearing in each of the 10 different spots. This is portrayed here as 10 different random variables, one for each spot. This example is taken from the video series that shows how to use Brobot’s state structure builder to automate the creation of an environment’s state structure.
In the state structure, all objects belonging to a state are defined inside of the state’s class. State objects conceptually have random variables associated with each action performed on them. These random variables materialize in the code as historical results, and are initialized with the object. The below example shows an object created with Brobot’s state structure builder. It is initialized with the results of Find.ALL operations on screenshots of the environment (a Find.ALL operation returns all matches for the given image), each result containing a variable number of matches and their locations. Empty matches could be provided to depict a failed find operation. A sample from this collection of results would be selected during a find operation in a simulation.
private final StateImageObject W = new StateImageObject.Builder()
.withImages("fishCatch-W2", "fishCatch-W3", "fishCatch-W_76,122,179,225_m_v")
.isFixed(false)
.withSearchRegion(787,388,371,60)
.addSnapshot(new MatchSnapshot.Builder()
.setActionOptions(ActionOptions.Find.ALL)
.addMatch(856,392,25,43)
.addMatch(782,392,25,43)
.addMatch(930,392,25,43)
.build())
.addSnapshot(new MatchSnapshot.Builder()
.setActionOptions(ActionOptions.Find.ALL)
.addMatch(777,394,25,44)
.build())
.addSnapshot(new MatchSnapshot.Builder()
.setActionOptions(ActionOptions.Find.ALL)
.addMatch(779,395,25,44)
.build())
.addSnapshot(new MatchSnapshot.Builder()
.setActionOptions(ActionOptions.Find.ALL)
.addMatch(791,393,25,44)
.addMatch(828,393,25,44)
.addMatch(865,393,25,44)
.build())
.build();
11 Discussion
In the same way the API provides a way for applications to communicate with each other, a visual API allows an automation application to communicate with its environment. It’s my hope that the visual API will serve as a standard for the development of robust automation solutions, and that it will grow along with advancements in machine vision to provide reliable and comprehensive access to graphical environments.