Using Color
Color requires version 1.0.4 or greater. Versions 1.0.5 and higher treat color differently than 1.0.4. A look under the hood at how versions 1.0.5 and higher deal with color can be found here.
Color can be used in a variety of ways to locate objects in a Brobot automation application.
It is selected in an ActionOptions variable as a Find option, and there are currently two
options: Find.COLOR and Find.HISTOGRAM.
Find.COLOR
Color is found by comparing the color of each pixel in the scene to the colors in the target images.
The way that the colors in the target images are represented affects the results, and can be modified
by the methods setKmeans and setMinScore. If k-means is set to 1, the average color of the target
images is calculated and compared to the pixels. If k-means is set to a number greater than 1, multiple
colors centers are calculated and compared to the pixels. The number of colors centers is the k-means value.
The MinScore works in a way similar to the MinSimilarity variable with traditional pattern matching. The higher
the MinScore, the more similar the colors must be to be considered a match.
Average Color
The Find.COLOR action first builds a color profile for the Image from its associated image files. It then uses this color profile to find areas of similar color on the screen. When k-means is set to 1, the average color of all pixels in the target images is used to find matches. Pixels on the screen receive scores with small penalties for distance to the average HSV values and large penalties for being outside the ranges of HSV values in the color profile.
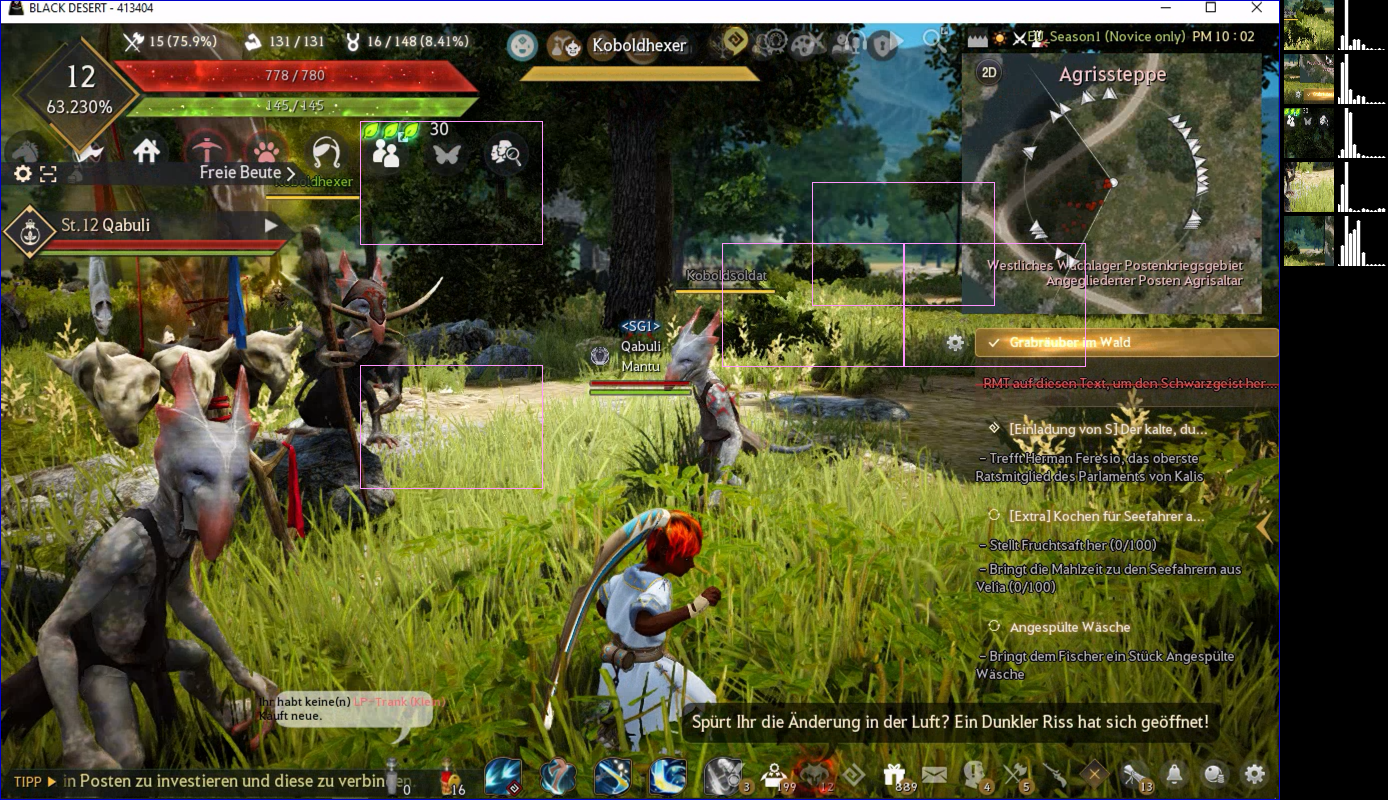
The image below is taken from the history folder of a Brobot application. The history folder is where illustrated screenshots, visual representations of actions taken during execution, are stored. This illustrated screenshot shows the results of a Find.COLOR action. Brobot built a color profile for an Image of a red dot (which being a Brobot Image object, allows for the inclusion of multiple image files, each captured from a different red dot). The Image is then searched for in the selected region (the minimap area), and the matches are shown as pink boxes. The colors shown at the far right of the illustrated screenshot are the contents of the matches. They show the colors that were found.
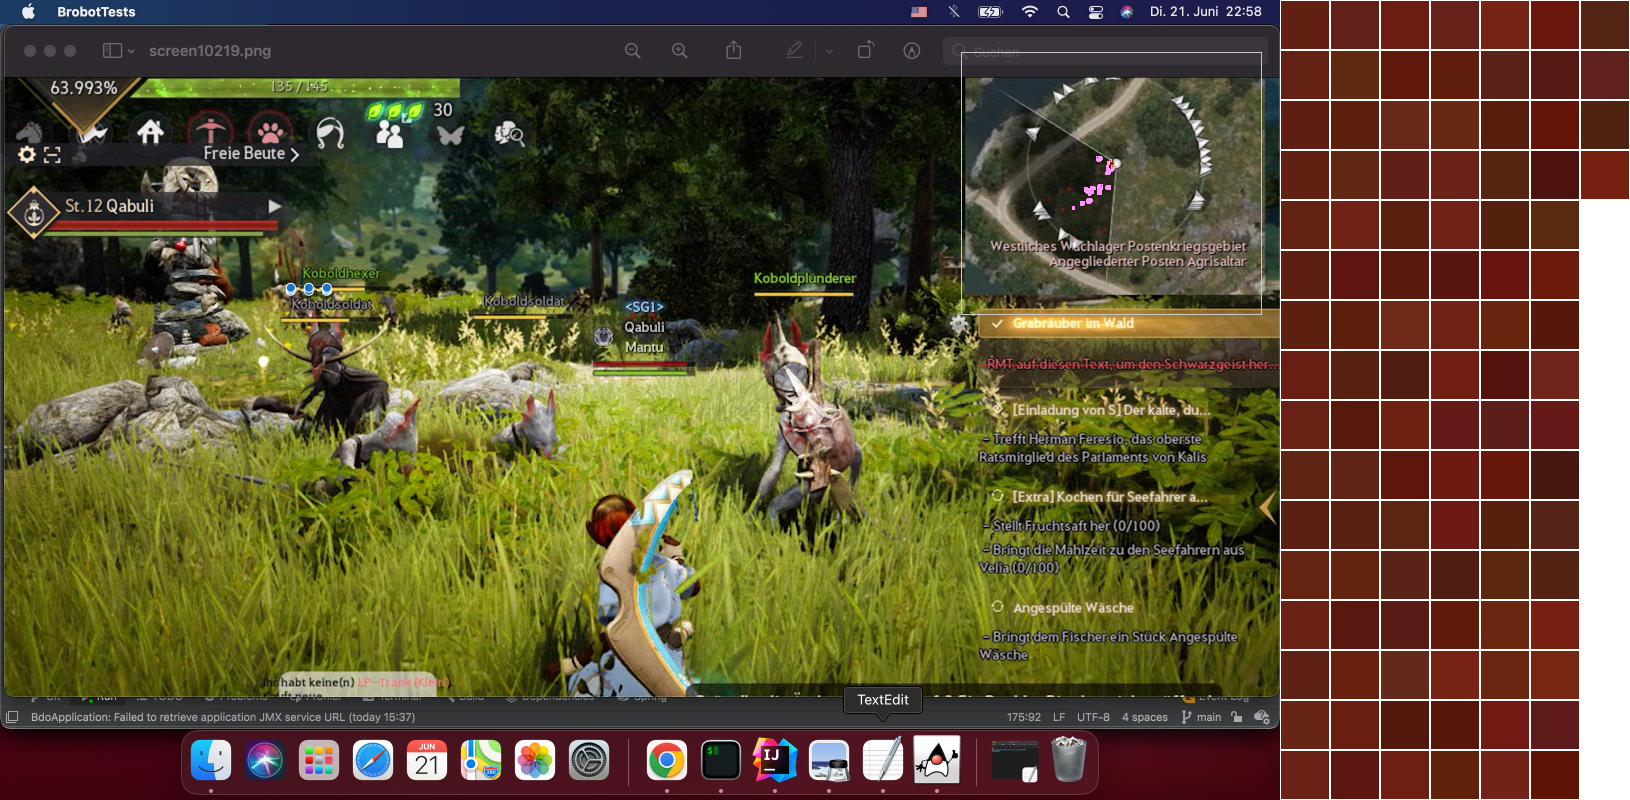
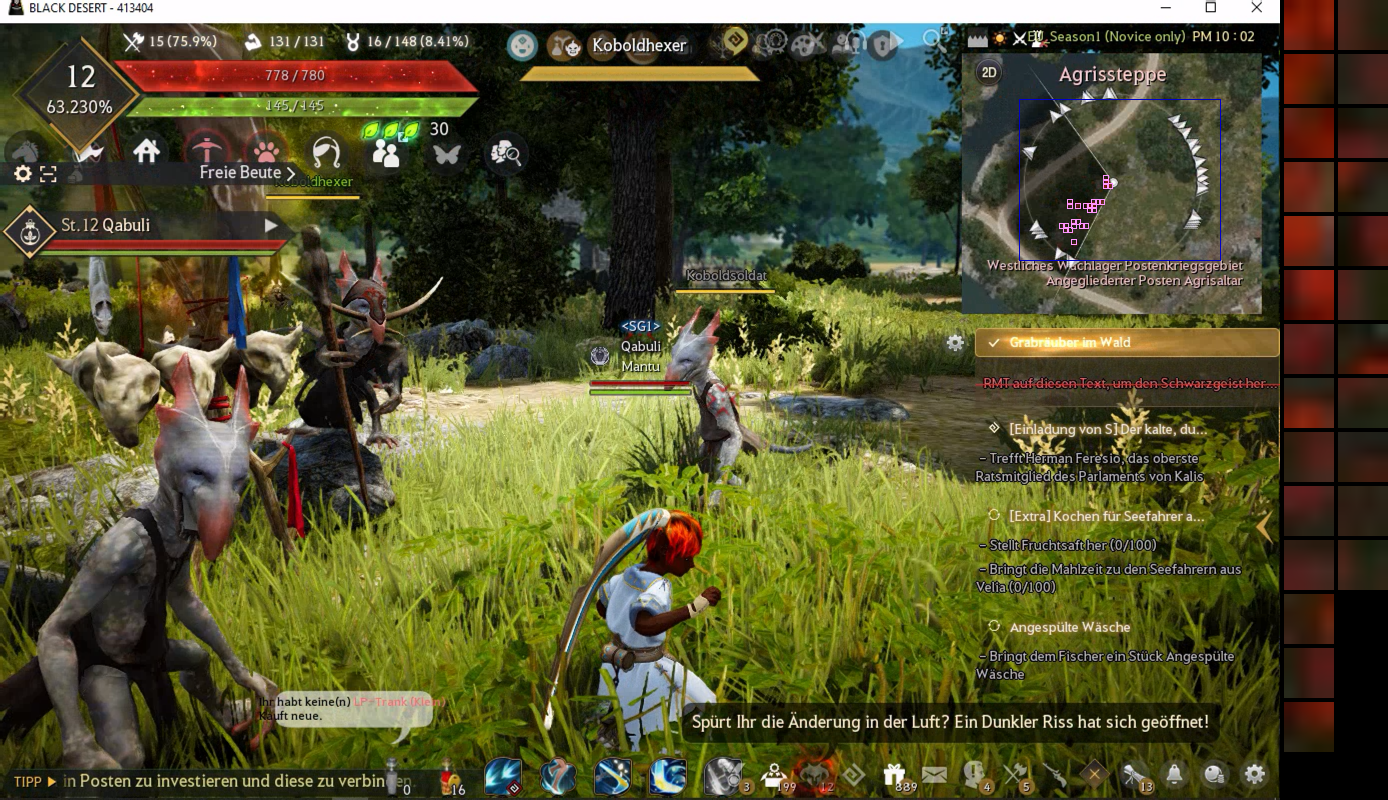
The below example shows the results of a similar operation on the red dot but allowing for a larger diameter.
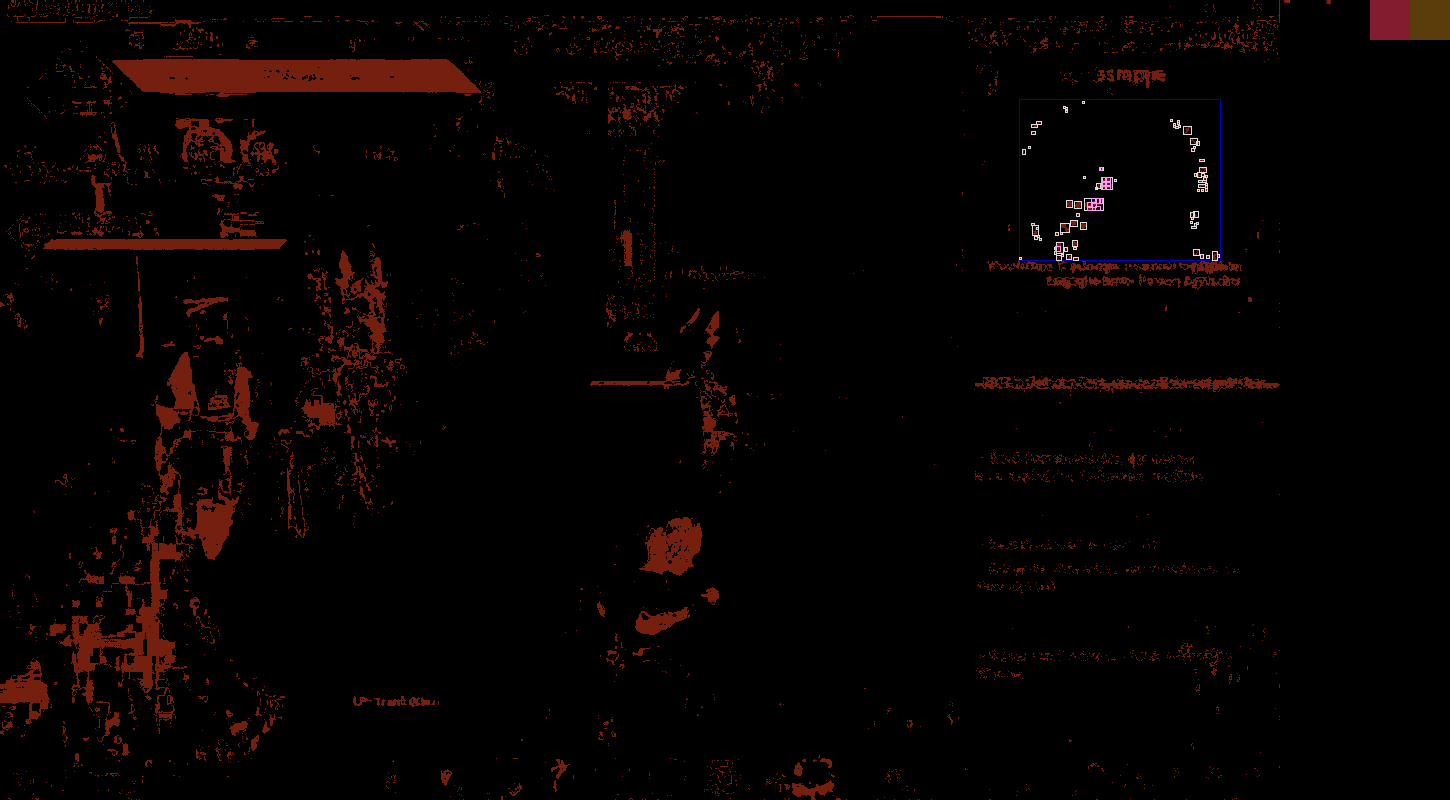
Also written to the history folder is the output of the classification operation of the Find.COLOR action. This output is a visual representation of where the target image's color was found on the entire scene. The search areas and matches are also shown. To the right of the scene, the image files of the red dot Brobot Image are displayed, as well as the color centers used to find the matches (here, k-means is set to 2 and there are 2 color centers).
Adjustable options include minScore, diameter, kmeans, and maxMatchesToActOn.
MinScore
Find.COLOR can be adjusted with respect to minScore and diameter. MinScore is
a measurement of similarity, similar to minSimilarity. Also like minSimilarity,
minScore has a scale of 0-1.00, where 1.00 is the most similar and 0 the least
similar.
Diameter
Diameter gives the minimum diameter of the color cluster. For example, a diameter of 1 allows for any pixel to be a match whereas a diameter of 2 translates to matches of size 2x2, where all 4 pixels need to meet the minScore requirements.
K-Means Colors
Looking for the average color works well for objects that have just one color, but not so well for objects with multiple colors. In this case we want to search for parts of the screen that contain all the colors in the object. The k-Means search method provides this functionality for us. It first determines the most prominent colors in the image and then looks for regions that match these colors. Matches are returned that contain colors most similar to the image's prominent colors. Not all prominent colors must be in a region, but all colors in a region should be similar to one of the prominent colors.
MaxMatchesToActOn
Also used often is maxMatchesToActOn, which limits the returned matches to a specific number. Setting minScore will return a variable number of matches, and setting maxMatchesToActOn will return a number of matches less than or equal to its value. For example, using a minScore of .95 may return 7 matches, and combined with a maxMatchesToActOn of 5, the result will be the 5 best matches.
Histogram
This find method searches for regions that have similar histograms to the given image. The histogram is calculated in HSV color space. Each image produces 5 histograms for 5 different areas of the image: an ellipse in the center, and the remaining 4 corner regions. This is done to preserve some spatial information; for example, an image of grass and blue sky would be more likely to match regions of grass and sky as compared to regions of a grassy hill above a lake.
MinScore can be adjusted as well as the variables that control the number of
HSV bins used to calculate the histograms: hueBins, saturationBins, and valueBins.
The default bin sizes for HSV, respectively, are 90, 2, and 1.
In the below example, maxMatchesToActOn is set to 5. The top match is the target image used for the Find.HISTOGRAM action.